Skip to main content
Questions :
- Look at the left graph and observe the age at 1945 from 10 to 35. What is one thing that the graph tells you immediately about the male population? Why do you think that happened?
- Do you agree with this statement? “The birth rate of male population is higher than female in general”. Explain your answers.
- Look at the right graph and observe the female population that was born from 1930 to 1935. How did this event affect the US population in the future? Is this phenomenon happened again anywhere in the graph?
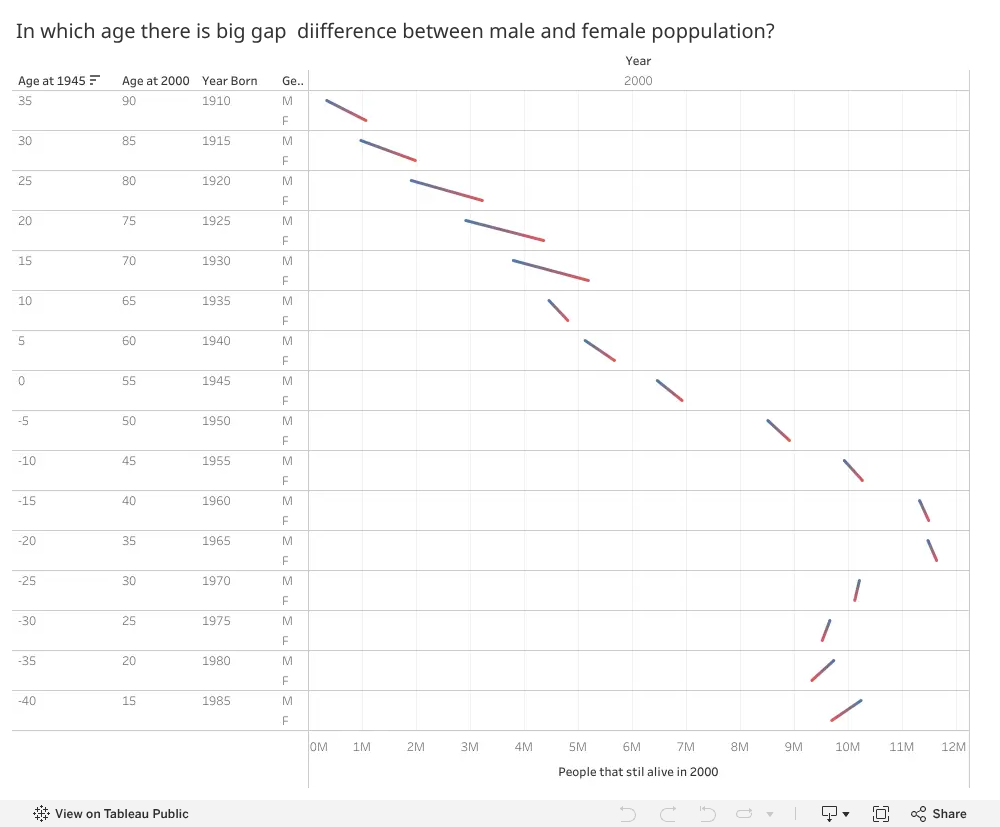
1) Each age group above the age of 10 appears to have a decreasing number of people in it. The reason for this could be World War 2.
ReplyDelete2) I honestly can’t tell. It looks like more females are born in general if the red part of the line is supposed to indicate females.
3) This happens nowhere else in the graph. The Great Depression might be responsible. This caused the difference in population between males and females to decrease.
This comment has been removed by the author.
ReplyDelete1. The lines are longer than in other age groups. The number of male is significantly smaller than female. The reason could be that many male died in World War II.
ReplyDelete2. I agree with this statement. Looking at age groups 0-5, male is greater than female.
3. The number female who were born earlier is higher than those who were born later. This could make the birth rate of the next generation decreases. This also happened for female who were born from 1980 to 1969.