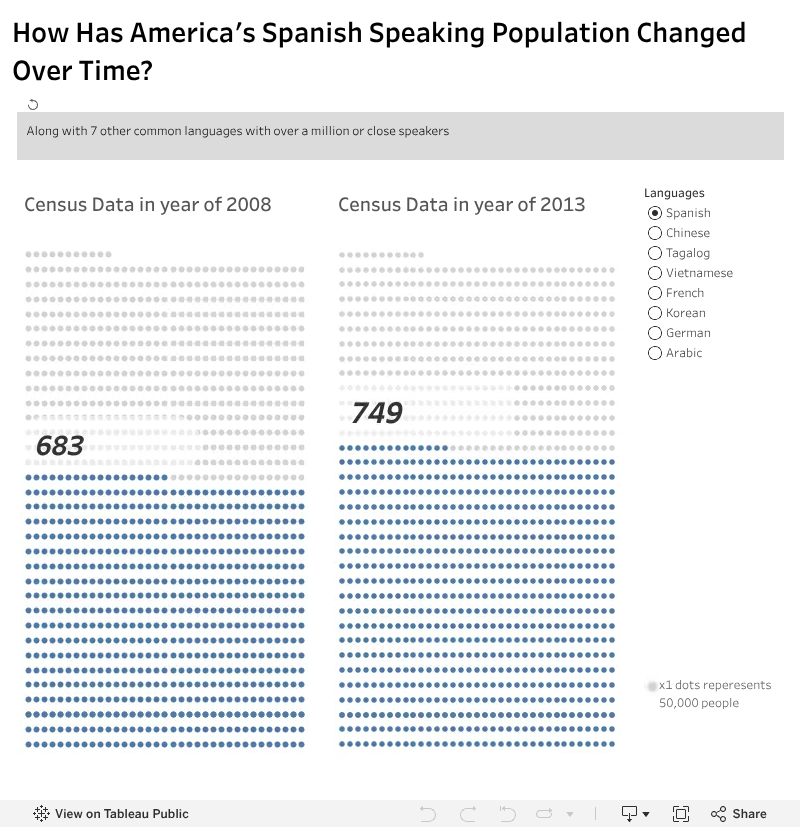
The visualization below is about people who speak languages other than english in their households, so the total will not be the whole population of USA but instead just the people who speaks languages other than english. The left graph is the amount of people by the end of 2008 and for the right graph is the amount of people by the end of 2013. There are 7 languages that has the most people spoken the languages
 Questions:
- Look at the graph and play with different languages filter. which of the languages increase in number of people and which of the languages decrease in number of people from year 2008 to 2013?
- Based on the visualization, what language do you want to learn? and why?
- What other information can you extrapolate from this visualization ?
Comments
Post a Comment